


1 min read
The New AktivBo Analytics – Smarter, Faster, Easier to Use
{% video_player "embed_player" overrideable=False, type='hsvideo2', hide_playlist=True, viral_sharing=False, embed_button=False, autoplay=False,...
2 min read

The development team at AktivBo is continuously working to improve our platform AktivBo Analytics. Most recently, there have been several upgrades that all users will hopefully appreciate. In an interview below, our CTO Anton Persson shares the biggest updates.

Anton Persson, CTO, AktivBo
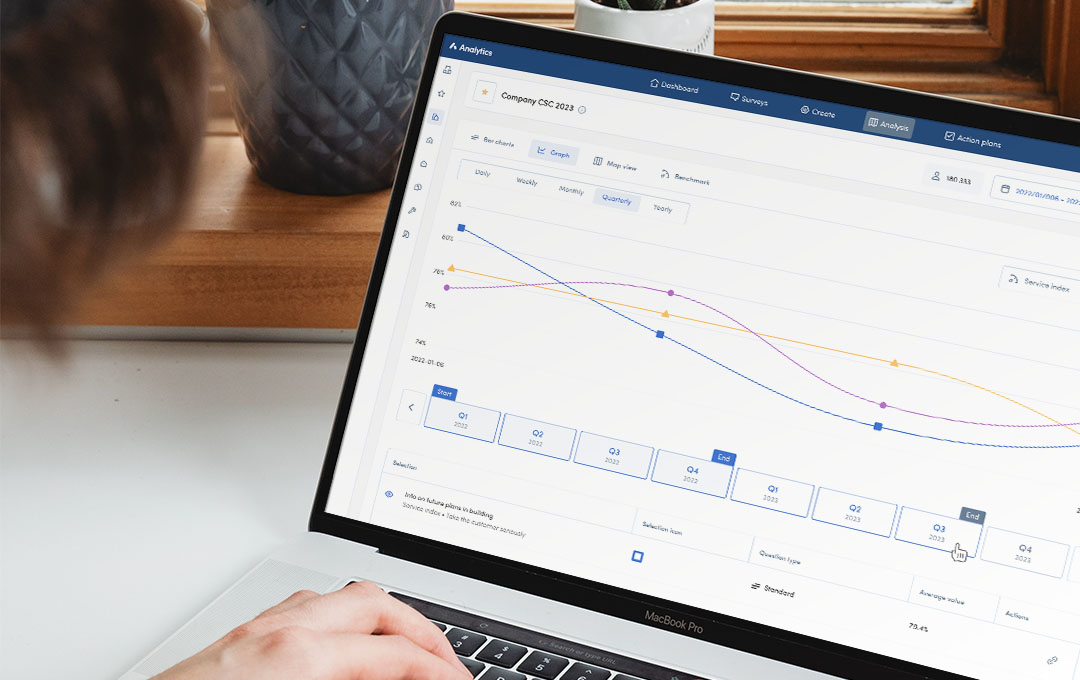
On one hand, curves, which is one of our most used features, have gotten a new look. A design upgrade that makes it easier to analyze the results over time. It's nicer to look at, but above all, easier to use. In addition, we have added completely new features that primarily support those who measure their customer satisfaction on an ongoing basis and send out regular surveys to their tenants.
Of course, there’s a lot of new stuff. Previously, the curves function was only able to deliver a predetermined interval to see the results in (for example, monthly). Now we've changed to a dynamic interval. This means that you can indefinitely choose whether you want to see your results broken down into days, weeks, months, quarters or years.
This long-awaited update means that you no longer need to switch views when you want to compare your performance with others in the industry.
We have also made it possible to compare their results against our benchmarks directly in the curves. We have listened to our users! This long-awaited update means that you no longer need to switch views when you want to compare your performance with others in the industry.
It is now also possible to combine and separate questions and projects when you want to get a result in the curves function. This makes it easy to make comparisons and see the development over long periods of time.
In addition, we have separated activity dates (e.g. move-in date in a move-in survey) from response dates, so that you can see the exact date when the tenants responded to their survey.
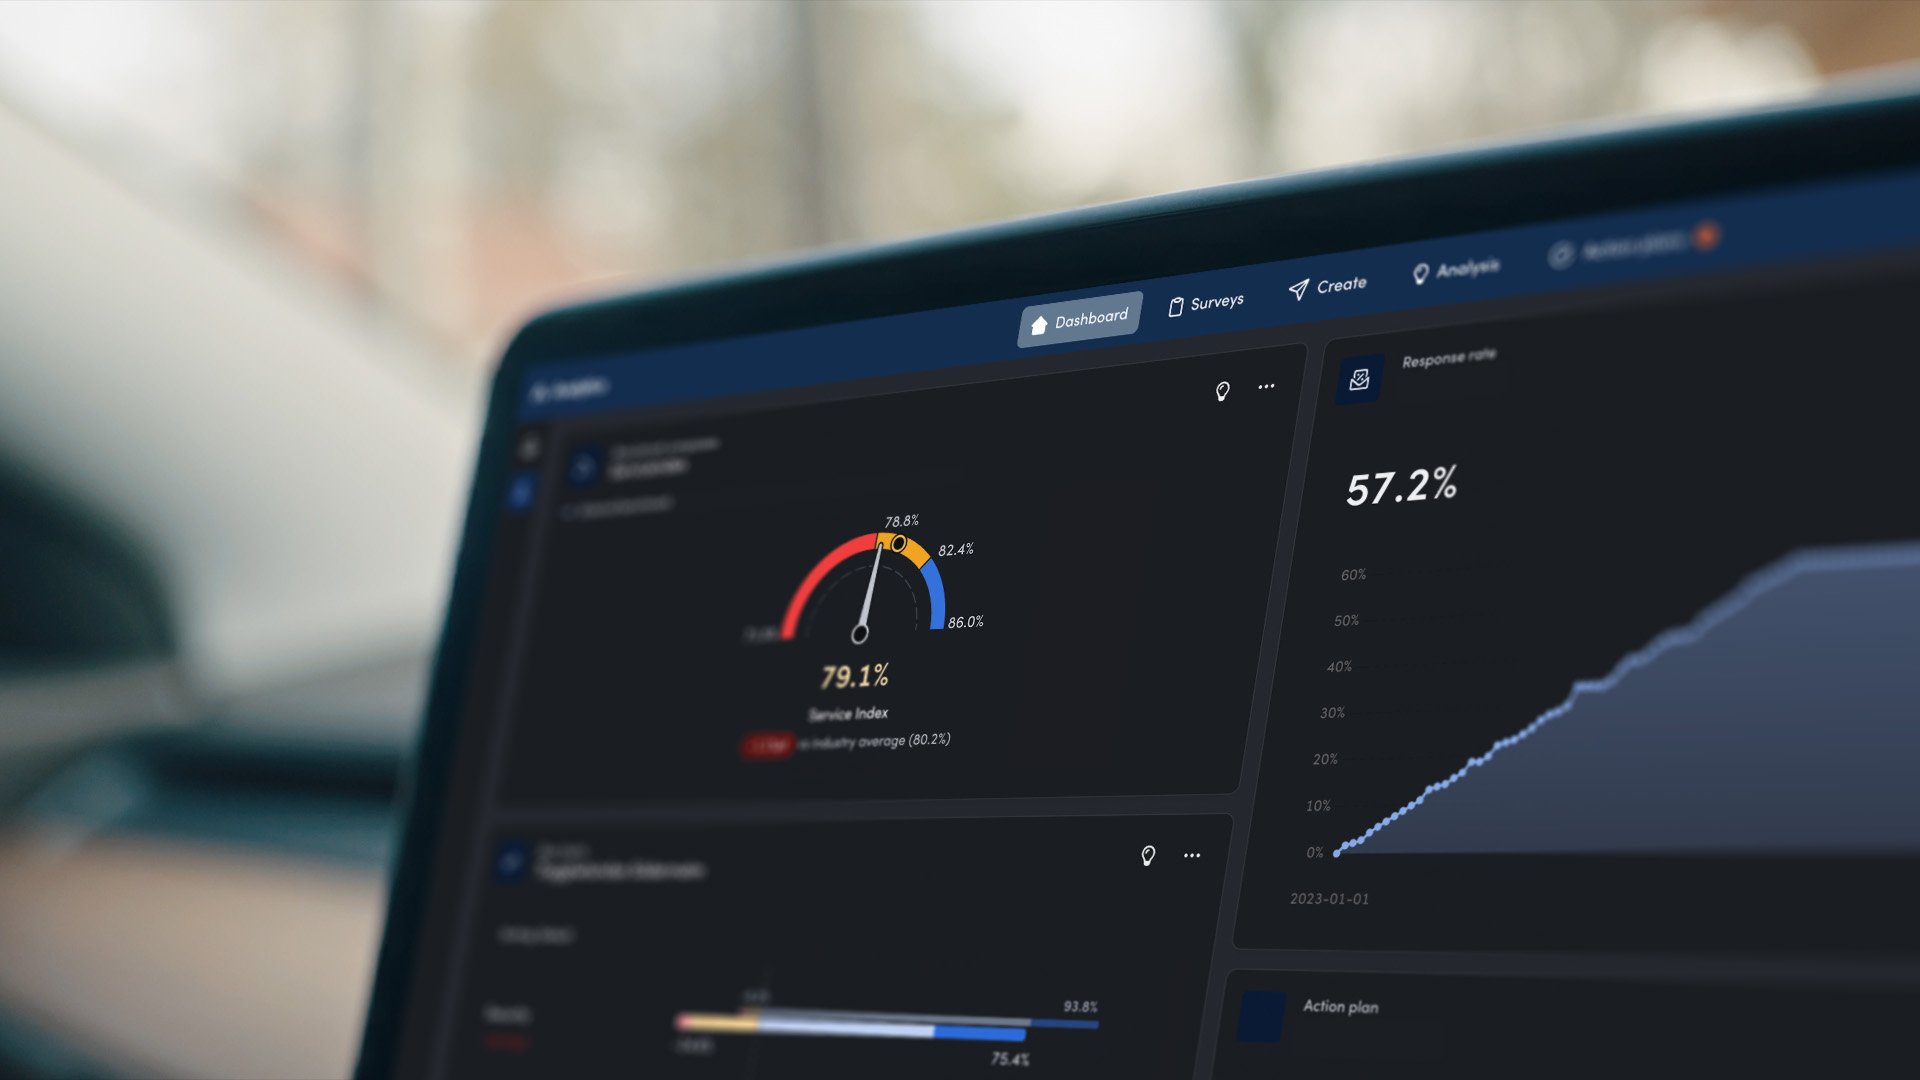
We have also developed the interface under the surveys tab. For example, you can more clearly see which response channels the respondents have used and break down the response rate on all filters available in the survey.
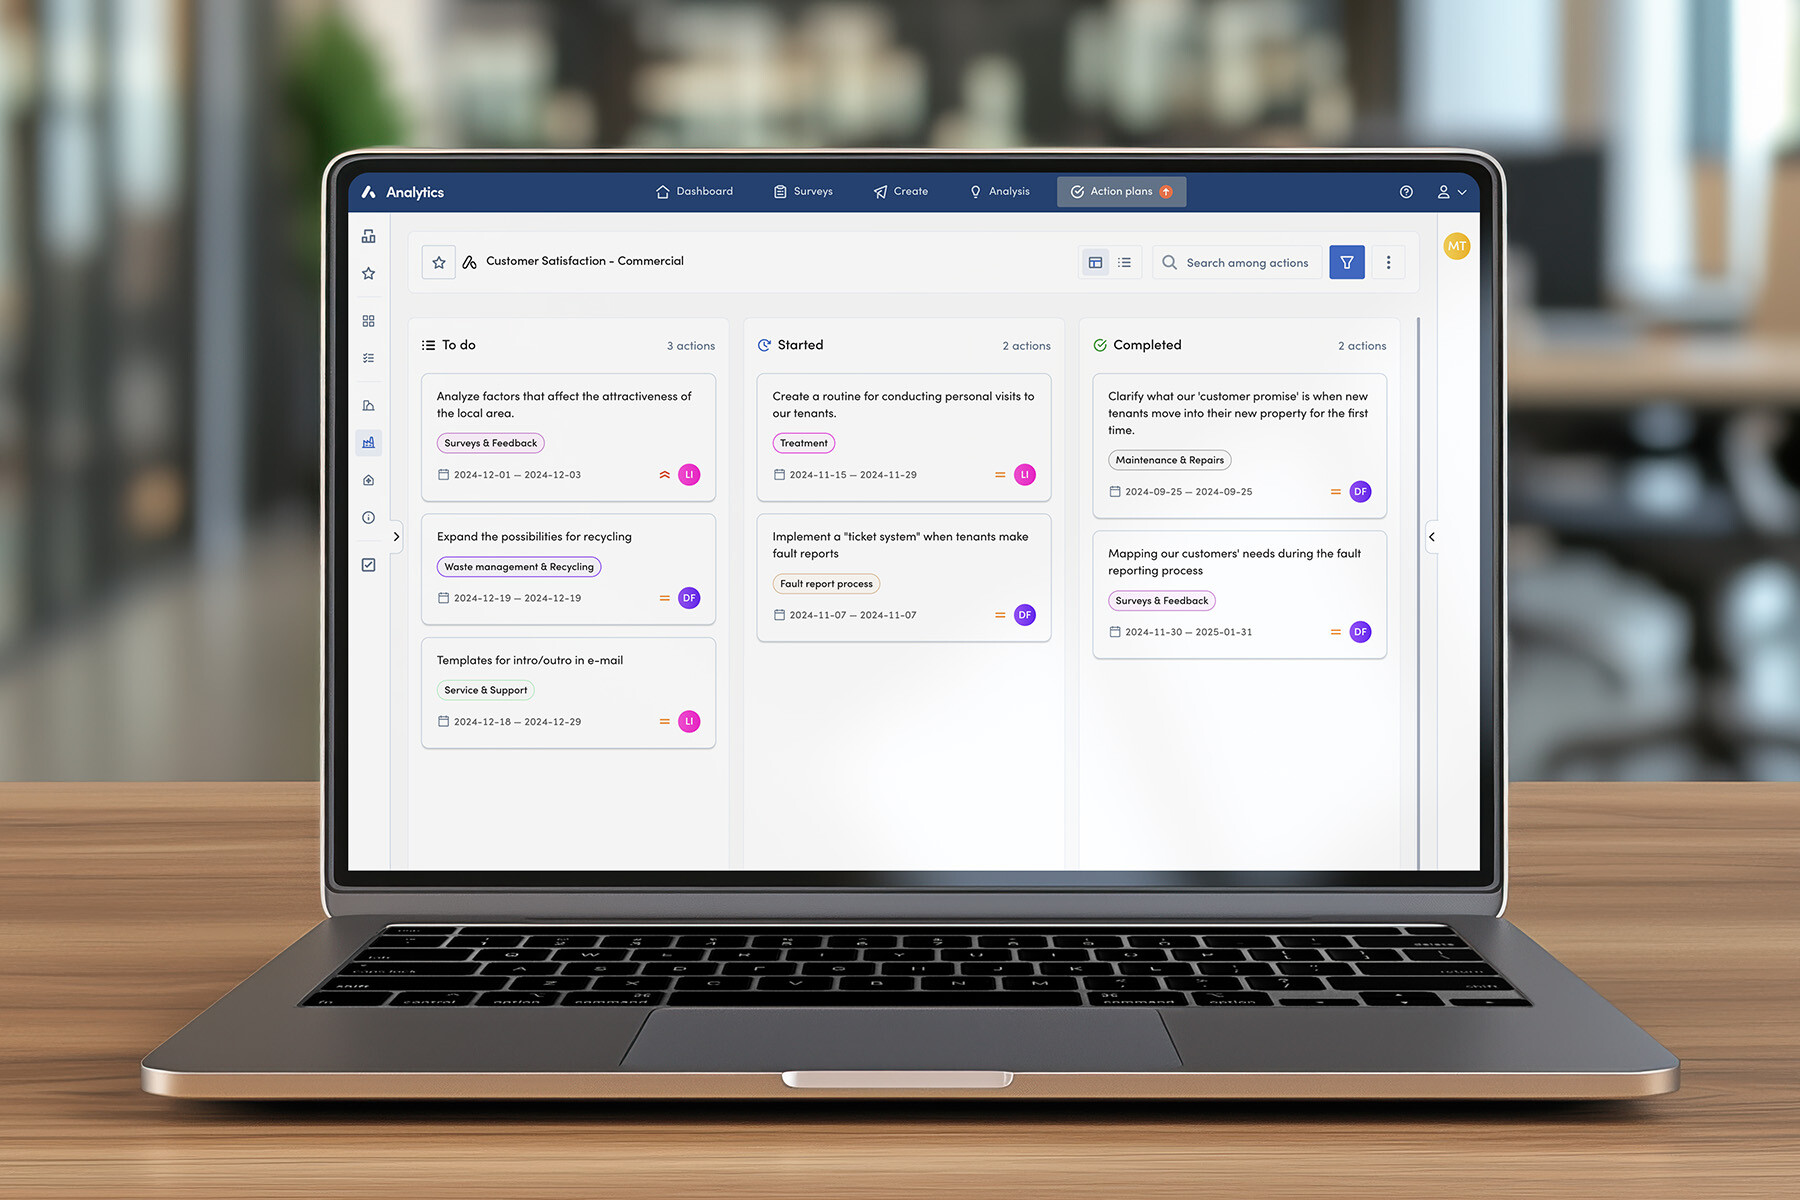
We've made all the menus in Analytics easier to navigate. We've upgraded the analysis tab, surveys tab, and curve interface. On the whole, the platform has also become faster and more stable!
1 min read
{% video_player "embed_player" overrideable=False, type='hsvideo2', hide_playlist=True, viral_sharing=False, embed_button=False, autoplay=False,...
1 min read
You gave us feedback – and we have listened! With an updated design of Analytics, you will experience an improved design as well as improved...
1 min read
Almost all professional real estate companies and property owners conduct tenant surveys to increase efficiency, customer satisfaction and improve...