



Commercial Real Estate
GLOBALTENANT EXPERIENCE
REPORT 2026
An AktivBo report based on 1,977 commercial tenant respondents across 19 countries.
Table of contents
Download the report- Preface
- The value of feedback
- Increased tenant satisfaction pays off
- The ROI of tenant satisfaction
- Continuous measurement as an important KPI
- More data and insights open up more potential for improvement
- About the report & method
Preface
Why tenant experience matters
In commercial real estate, the quality of service a landlord delivers is what tenants experience most often, every working day, across dozens of small interactions with the building and its operator. Done well, it creates a positive sentiment towards the landlord or property manager. Done less well, it becomes a daily friction that compounds across the length of a multi-year lease, and across the renewal decisions that follow.
That makes structured tenant feedback more than a satisfaction check. It is one of the clearest signals a property company has of whether its operations are successful and on par with the expectations. And also where to invest attention before the next renewal conversation.
At AktivBo, we have spent more than two decades helping property companies listen to their tenants, residential and commercial, across more than 20 countries. Our standardized survey methodology makes it possible to benchmark satisfaction not only within a portfolio, but across organizations, markets, and property types. The participants in this report share a commitment to using tenant feedback as a management tool, not merely an annual exercise.
What this year's report reveals
This report complements quantitative satisfaction scores with a large-scale analysis of open-ended tenant comments, classified by category and sentiment using AI.
The picture that emerges is consistent across markets: tenants experience their landlord through people, not assets. A property company that responds quickly, communicates clearly and follows through on what it has promised earns satisfaction even where the building is imperfect. A property company that is slow, distant or unreliable loses ground even where the building is excellent.
We hope this report offers insights and a chance to see where your organization stands relative to peers, and concrete evidence of where improvement efforts will have the greatest impact on tenant loyalty and retention.
The AktivBo Team behind the report

Jon Svensson
Chief Executive Officer

Frida Kullh
Chief Operating Officer

Martin Talme
Chief Business Officer

Vendela Meyerhöffer
Analysis & Customer Development

Jonatan Moen
Customer Development Manager
The value of feedback
Systematic tenant feedback creates measurable value, from lower vacancy and fewer complaints to stronger net operating income. Here is how structured measurement translates into results.
Lower vacancy and turnover
Tenants who feel heard stay longer. Reducing turnover by even one lease saves re-letting fees, fit-out costs, and months of lost rent, often amounting to 6–12 months' rental value per unit.
Fewer complaints
When issues surface early through surveys, they can be resolved before they escalate. Proactive management reduces formal complaints and the resource cost of handling them.
Increased quality
Higher satisfaction supports stronger pricing power. Satisfied tenants are more willing to accept rental adjustments when they see that their landlord prioritizes their experience.
Efficiency benefits
Structured data replaces guesswork. Property managers can prioritize the right actions, allocate budgets more effectively, and demonstrate ROI on improvement initiatives.
Controlling excellence
By measuring and following up on external contractors, real estate companies can ensure quality and costs in all agreements.
Brand development
A strong tenant experience becomes a competitive advantage in attracting new tenants. Satisfaction data gives marketing teams credible proof points.
Increased tenant satisfaction pays off
Tenant experience has long been treated as a soft issue in a hard industry. Customer orientation is a structural input to net operating income and it shows up in retention and tenant turnover, in operating cost and staff productivity, in brand strength, and in how a portfolio is valued by lenders, investors and ESG raters. Property companies that treat tenant satisfaction with the same seriousness as their financial metrics earn a measurable, repeatable return through the cycle. The ROI is real, and the next section puts a figure on it.
28 studies across 11 countries
Peer-reviewed and industry research from MIT, Henley, NAA, Vesteda, and more.
Proven ROI
Retention, vacancy, work-order cost, rent achievement along with other tangible metrics — translatable to hard financial outcomes.


The ROI of tenant satisfaction
Example portfolio
300,000 m²
+1%pts tenant-satisfaction uplift
Assumptions:
Example: rent €280/m²/yr; turnover cost €200/m²; work orders 30/1,000m²/yr at €350 each.
Continuous measurement as an important KPI
The case for continuous measurement
An increasing number of property companies are choosing to track tenant satisfaction continuously, through daily or weekly survey distribution, often integrated with their property management system. This reduces manual work, improves data privacy compliance, and makes it easier to embed customer insights into daily operations throughout the year.
From project to KPI
With continuous follow-up, results tend to become more even and representative over time. When feedback is collected on an ongoing basis, the risk of the overall picture being disproportionately affected by isolated events during specific periods decreases, and it becomes easier to distinguish temporary variations from actual trends.
Frequent follow-up turns tenant experience into a KPI that is systematically tracked, discussed, and continuously improved, rather than a project activated on an occasional basis.


More data and insights open up more potential for improvement
The tenant experience is not created by a single event but builds up step by step throughout the entire “customer journey,” in dealing with the landlord's processes, communication, and services. From the first contact and signing of the contract, through move-in and ongoing administration, to reporting damage, customer service, and move-out, the overall impression emerges through a series of clear touchpoints. When these work well, they create an experience of order, security, and professionalism that strengthens the relationship over time.
This is why commercial real estate companies are choosing to complement the annual overall assessment with targeted surveys at selected stages of the customer journey. By tracking several touchpoints, close in time to the events actually experienced, companies gain a more precise basis for improvement. It becomes easier to distinguish between one-off events and recurring points of friction, to understand at which point in the process the experience is impaired, and to prioritize the right measures in the right place. An at least equally important effect is that feedback occurs while it is still current, which creates better conditions for taking action quickly as soon as, or before, something does not go optimally.
Below you see an example of customer journey touchpoints for commercial real estate companies.
 Leasing/Contract signing
 Move-in
 Renovation
 Fault report
 Customer service
 Move-out
CSC: Commercial
About the report & method
This report draws on data collected through AktivBo’s standardized commercial tenant satisfaction survey, spanning Europe, North America, South America, and Oceania.
Who participates
Participants include institutional investors, listed REITs, pan-European asset managers, and multi-national property companies. Several use third-party property managers to run day-to-day operations.
What types of properties
The portfolio covers commercial offices, healthcare facilities, medical office buildings, logistics, retail, and mixed-use premises.
How results are calculated
Each participant runs AktivBo’s tenant satisfaction survey, covering standardized questions mapped to 19 common categories plus NPS. Respondents rate their experience on standardized scales. Results are presented as the positive share — the percentage selecting either of the two positive options on a four-grade scale. All scores are averages across projects, giving each equal weight. In addition, 4,680 open-ended comments were classified by category and sentiment.
About response rates
The overall response rate is 34%, but the spread between individual participants is wide, ranging from below 20% to above 80%. Method matters more than market: surveys distributed by email alone sit at the lower end, while combinations of email, SMS, tenant app or portal notifications and follow-up reminders lift results considerably. Timing and contact data quality play a similar role.
The companies that consistently reach above 80% treat the survey as an active part of the tenant dialogue rather than a one-off distribution. They announce the survey in advance, ask property and asset managers to raise it in person during site visits, and follow up with non-respondents. Some also use incentive programmes, such as a donation to charity per completed response or a prize draw.
Above all, response rates are built over time. Tenants answer when they can see that their feedback is taken seriously, so the strongest performers close the loop every round: they share the results, act on what the data shows, and communicate the concrete improvements back to tenants. Each cycle of visible action makes the next survey easier to answer, which is how a high response rate becomes durable rather than a one-off achievement.
4 continents
tenant respondents
categories + NPS
comments analyzed
19 countries across 4 continents
The dataset spans Europe, North America, South America, and Oceania, covering mature and emerging commercial property markets.

- Australia
- Belgium
- Brazil
- Canada
- Czech Republic
- Denmark
- Finland
- France
- Germany
- Ireland
- Italy
- Luxembourg
- Netherlands
- New Zealand
- Norway
- Spain
- Sweden
- United Kingdom
- United States
Key findings at a glance
What tenants value
Location, Billing, and Premises all score above 82%. The physical product and its position are strengths across the portfolio.
Top 3 categories
Neighborhood
Accounting
Suitability
What drives loyalty
Three of the strongest NPS drivers: Waste Management, Landscaping, and Cleaning all rank in the bottom half. Operational follow-through, not the building, determines retention.
Strongest NPS correlation
Where to act
Communication scores below average but is the most actionable lever. It drives NPS, amplifies service perception, and can be improved quickly through better digital channels and proactive updates.
Communication score
The gap between what scores well and what drives loyalty is where the biggest opportunity lies. Investing in operational categories, particularly Cleaning, Waste Management, and Communication, offers the highest return on tenant retention.
Sustainability as a competitive factor
Sustainability issues continue to be central. This development is driven partly by stricter regulations and reporting requirements, and partly by tenants increasingly factoring sustainability into their decisions. The focus on sustainability has had a growing impact on the real estate industry, not least in connection with reporting and standards such as CSRD and GRESB. Sustainability also affects the ability to retain and attract customers. This year's results show that sustainability remains an area where expectations are high.
Want to learn how to get up to 6 GRESB points?
AktivBo is a:


The challenge is loyalty
Commercial tenants rate their overall satisfaction at 82.3%. A result that places the physical product and administrative functions in good standing. Location (92.2%) and Billing (85.7%) lead, confirming that the fixed assets and back-office processes work well.
Yet NPS, which measures the balance between tenants who would actively recommend their landlord and those who would not, sits at just −1.
A negative score means detractors slightly outnumber promoters: tenants are content but not advocates. The categories most strongly correlated with NPS are operational: Waste Management, Landscaping, and Problem Resolution. These are precisely the areas where scores are weakest and variation between projects is widest.
Scale 0%–100%
Scale −100 to +100
All 19 categories ranked
The top tier: Location, Billing and Premises confirms that tenants value the physical product. Yet three of the strongest NPS drivers: Waste Management, Landscaping, and Cleaning all rank in the bottom half. The gap between what scores well and what drives loyalty is where the biggest opportunity lies and suggests that operational follow-through, not the building itself, determines whether tenants stay.
Five themes that shape the tenant experience
The 19 categories cluster into five themes. Value & Location leads. Common Areas & Operations sits at the bottom and is also where loyalty is decided.
- Location92.2%
- Billing85.7%
- Lease Renewal62.5%
- Premises82.3%
- Appearance78.9%
- Maintenance74.8%
- Problem Res.77.9%
- Responsiveness76.8%
- Service Quality75.4%
- Communication70.8%
- Security77.8%
- Parking73.5%
- Indoor Climate68.0%
- Elevators75.8%
- Waste69.9%
- Signage69.6%
- Landscaping68.4%
- Cleaning65.1%

Value &
Location
- Location is the top-rated category at 92.2%
- Billing & Accounting scores reliably high at 85.7%
- Lease Renewal Intent at 62.5% is the weakest in this group
- Tenants value the address, but staying is another question
The foundation is solid but lease renewal lags
Location (92.2%) is the clear standout. Tenants are satisfied with where their premises sit. Billing and Accounting (85.7%) confirms smooth administrative processes. But Lease Renewal Intent (62.5%) breaks the pattern: tenants like the location and the admin, yet their willingness to renew is notably lower. This gap suggests that operational experience and service quality weigh more heavily in retention decisions than the physical asset itself.
Tenants are satisfied with where their premises sit.
Confirms smooth administrative processes across the panel.
The weakest score in this group and in all categories, a signal that location alone does not retain tenants.

Operations
& Comfort
- Cleaning (65.1%) and Indoor Climate (68.0%) are the weakest areas
- These operational categories correlate most strongly with NPS
- Day-to-day experience drives loyalty more than fixed assets
- The biggest improvement opportunity sits in daily operations
Cleaning, Indoor Climate, and Landscaping:
the operational gap
The bottom of the ranking is dominated by operational categories, the day-to-day services that tenants experience regularly. Cleaning at 65.1%, Indoor Climate at 68.0%, and Landscaping at 68.4% form a cluster of underperformance. These are also among the categories most strongly correlated with NPS, meaning low operational scores directly suppress tenant loyalty.
Unlike location or premises, which are largely fixed, operational categories represent the clearest improvement opportunities. But responsibility is not always straightforward. In many portfolios, day-to-day services like Cleaning, Waste Management and Landscaping are delivered by third-party property managers rather than the landlord directly. Tenants, meanwhile, may themselves be responsible for parts of their indoor environment or waste handling, without always knowing it. The data suggests that where boundaries of responsibility are unclear, satisfaction suffers. Defining and communicating who is responsible for what, between landlord, property manager and tenant, is a prerequisite for improving scores in these categories.
NPS correlation 0.80 — a strong driver of loyalty hiding in the worst-performing area.
Range: 30%–84%. One of the categories with the biggest variation between top and bottom performers.
NPS correlation 0.83 — outranked only by waste management as a predictor of loyalty.
Content but uncommitted
The overall NPS of −1 tells a story that satisfaction scores alone cannot: commercial tenants' willingness to recommend is essentially neutral even though they have a fairly high overall satisfaction (82.3%).
NPS varies across performers, ranging from −61 to +73. This 134-point range exceeds the spread in satisfaction scores, confirming that loyalty is far more volatile than satisfaction.
Performance range: −61 to +73.
What drives loyalty?
The daily experience, not the asset
Operational and relational categories correlate most strongly with NPS, and they are also the lowest-scoring areas.
Improving what tenants see and experience daily will move the NPS needle.
Operational & Relational
Service & Value
Correlation with NPS. Higher values indicate stronger loyalty signal.
CASE: CP Group
Tenant Experience as a competitive advantage
In recent years, the office market has undergone significant structural changes. Most notably, tenants are no longer focused solely on location and rent levels; they are prioritizing tenant experience, service levels, and how the work environment helps them compete for talent.
Florida-based CP Group has invested heavily in positioning itself as a premium player by building service and experience into its core business model. The company owns and manages commercial real estate across the Southeast and Southwest United States, with approximately $8 billion in assets and 64 million square feet. Because the company both owns and manages its properties, it has end-to-end control over delivery and customer experience.
Acting on that advantage, CP Group launched its Tenant Experience program in 2019, built on a simple observation: As technology dissolved the line between work and personal life, people came to expect the same standard of service at the office — while the workplace itself had barely changed. The pandemic only accelerated that shift, and CP Group expanded its commitment, aiming to create value in tenants' daily lives by offering best-in-class service rather than just space.
Service as a differentiation strategy: the Ritz-Carlton concept
Looking to the hotel industry, CP Group approached the Ritz-Carlton Leadership Center to adapt its renowned service approach for CP Group. The result was a program built on focus on decision-makers and systematic measurement and improvement.
At the heart of the program was a shift from reactive property management to proactive relationship building. Clear service standards guide every interaction, such as the 15/5 rule, which calls for establishing eye contact within 15 feet and offering a greeting within 5 feet. Each customer receives a quarterly follow-up, and all feedback is documented in the company's CRM. This creates a consistent framework for engagement, accountability, and reporting across the organization.
Personal service: a competitive advantage in an AI-driven era
Across the customer service landscape, automation and AI agents are rapidly displacing human interaction. Chatbots field routine inquiries, digital concierges handle requests, and entire service tiers are being reengineered around efficiency.
The same pressures are reaching commercial real estate, where some operators are exploring AI-driven tenant interactions and automated service workflows.
The conditions for competitive advantage
Leadership is a crucial success factor. CP Group’s service culture is driven from the top, with a clear “lead by example” approach. When senior management consistently demonstrates that service is business-critical, the rest of the organization follows. That kind of internal alignment matters in an industry that has historically treated property management as a cost center rather than a strategic asset.
CP Group's experience demonstrates that tenant experience—when delivered consistently, grounded in data, and championed by leadership—becomes a genuine competitive advantage in a market where location, rent, and building quality are no longer enough on their own to differentiate.

Trust &
Dialogue
- Problem Resolution is the 3rd strongest NPS driver
- Trust is built through dialogue, responsiveness, and follow-through
- When Communication outscores Problem Resolution, trust erodes
The trust triangle: communicate, respond, resolve
AktivBo’s experience shows that trust between landlord and tenant is built through three connected capabilities. Together they form a “trust triangle” that predicts loyalty better than any single category.

Key insight
Communication is the highest-ROI lever for commercial tenant loyalty. It scores below average (70.8%), strongly drives NPS, and is a highly actionable category to improve — better digital channels, proactive updates, and transparent processes can move the needle quickly. Problem Resolution (77.9%) now scores above average and is the strongest NPS driver among the trust pillars, underscoring that follow-through matters as much as dialogue.

Performance
Variation
- Communication has the widest performance spread across customers
- NPS ranges from −61 to +73 across customers
- Indoor Climate, Parking and Overall Satisfaction all show gaps exceeding 45%pts
- Best-practice sharing could lift the bottom performers significantly
How performance varies across the dataset
Top Quartile
Top-quartile performers score +96.1% on satisfaction and NPS above +30.
Bottom Quartile
Bottom-quartile performers score below 74.3% on satisfaction with NPS deep in negative territory.
The range between the top and bottom performers is substantial, particularly for NPS, where the 134-point gap exceeds the 53%pts spread in satisfaction. In practical terms, two tenants in comparable buildings but under different landlords can have fundamentally different experiences, one an advocate, the other actively looking to leave. This variation is not random; it reflects real differences in how property managers communicate, respond to issues, and maintain the operational environment.
Where performance differs most
The five categories with the widest performance spread across performers. A large gap signals inconsistency, and an opportunity for best-practice sharing.


What tenants
are saying &
what AI reveals
- 4,680 classified open-ended comments analyzed
- 47% of comments are negative
- 66% of all comments are actionable
- Sentiment confirms quantitative weaknesses, and reveals hidden risks
Agentic AI turns tenant feedback into actionable intelligence
Built for property, powered by data
AktivBo builds AI services that are unique of their kind, developed exclusively to analyze tenant feedback. This is made possible by the fact that we operate in a single vertical — the real estate industry — working alongside 500+ property companies across more than 20 countries. It is the specialization, and the depth of data, that allows our models to recognize the industry’s patterns, terminology and connections.
How it works
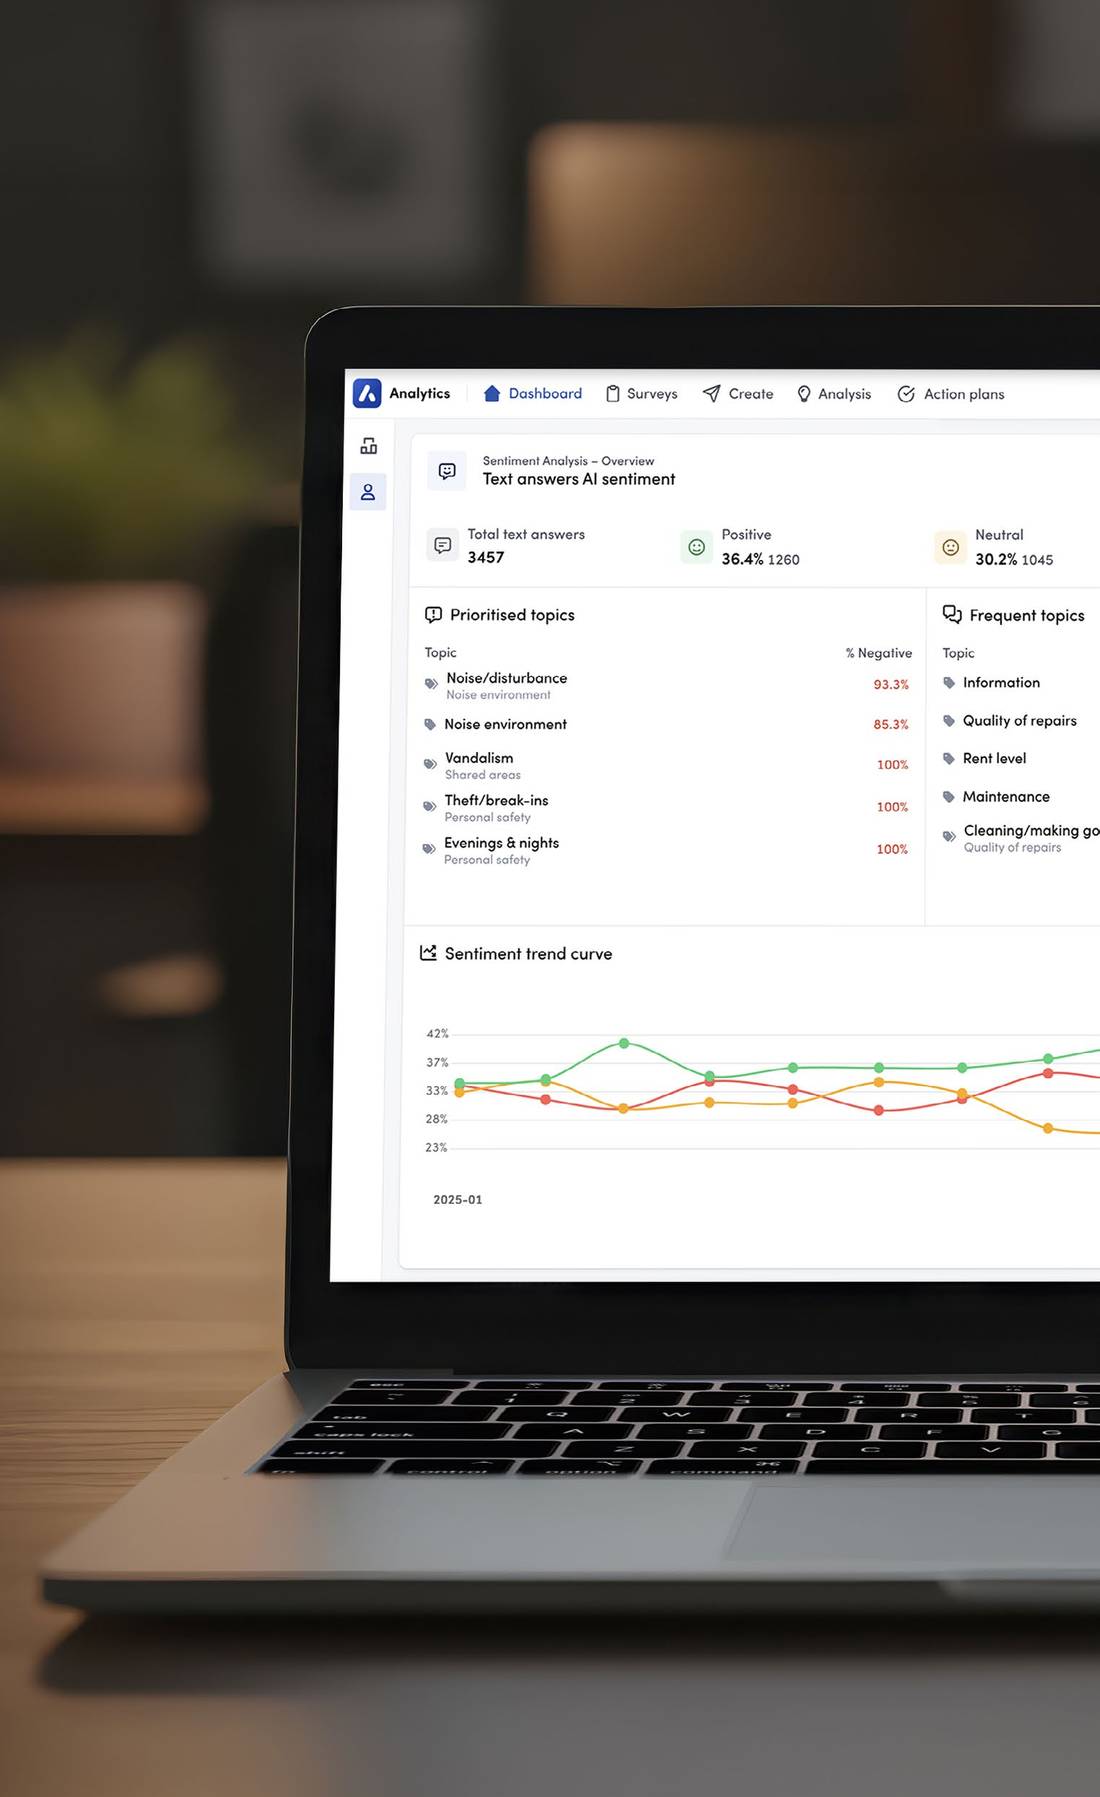
AI agents interpret, classify, and prioritize unlimited amounts of responses automatically — connecting each comment to the right category and touchpoint in the customer journey. The models don't just categorize sentiment; they identify where frustration concentrates, flag emerging risks, and surface the actions with the greatest impact on satisfaction and retention.
From quantitative data to qualitative insights
In practice, this means that thousands of open-ended responses from tenants can be interpreted, summarized and connected to the right touchpoint in the customer journey. The platform automatically surfaces the actions that have the greatest impact on tenant satisfaction, and satisfied tenants ultimately lead to lower vacancy rates and stronger net operating income.
This is AI that does not guess
It compares, prioritizes, and points the way forward. Every comment is linked to the relevant category, placing tenants’ own words in relation to the areas being measured.
Where tenants complain and where they don't
Of 4,680 open-ended comments, 47% are negative, 27% neutral, and 25% positive. The distribution varies sharply by category. Indoor Climate draws the most negative sentiment (81%), followed by Elevators (76%) and Maintenance (73%). Service Quality stands out, tenants notice and appreciate good staff even when buildings frustrate them.
% Negative comments by category
The Disconnect
Satisfaction scores capture whether basic expectations are met, but open-ended comments reveal whether tenants are frustrated enough to say something about it. The gap between these two signals points to hidden risks that the next section explores.
Where tenant comments complete the picture
Five categories score ≥75.4% yet more than 60% of their open-ended comments are negative. Even though the results are above average, there is valuable actionable feedback from tenants that completes the scores and paints the full picture.
Hidden risks
High score, high negative sentiment
- ElevatorsScore 75.8%76%
- Security & SafetyScore 77.8%68%
- Problem ResolutionScore 77.9%65%
- Billing & AccountingScore 85.7%63%
- Property AppearanceScore 78.9%61%
Theme sentiment
% negative
- Safety & Comfort74%
- Common Areas & Ops64%
- Physical Product59%
- Service & Dialogue38%
- Value & Location37%
Service Quality & Staff
The strongest signal in the data
Tenants notice and value good people, even when buildings underperform. Staff are the single biggest opportunity to turn a frustrated tenant into an advocate.
The highest of any category
Quantitative and qualitative data conclusions
The loyalty gap runs deeper than scores suggest
Satisfaction is 82.3% but NPS is −1. Sentiment confirms the disconnect: 47% of all open-ended comments are negative.
Operational weaknesses are confirmed from both sides
Cleaning, Indoor Climate and Landscaping score lowest in the survey and draw the highest negative sentiment. Indoor Climate alone has 81% negative comments. Both data sources point to the same conclusion: daily operations need focused action.
Staff are your strongest asset
Service Quality has the highest share of positive comments (71%) of any category. Tenants notice and value good people even when buildings underperform. Staff are the single biggest opportunity to turn a frustrated tenant into an advocate.
Scores and comments combined
Five categories score above 75% in the survey but have more than 60% negative comments. What the tenants write in their own words adds information to the scores, especially Elevators, Security, Billing, Problem Resolution, and Property Appearance.
Communication is the highest-ROI lever
Communication scores below average (70.8%), strongly drives NPS, has the widest performance spread (67%pts), and is highly actionable. Sentiment data can guide exactly what to improve: digital channels, proactive updates, and transparency.
Benchmark and share best practice
Communication varies 67%pts across projects. The gap between top and bottom performers represents a massive opportunity for peer learning.
AktivBo Analytics
A Tenant Experience platform driven by agentic AI

Built for the real estate industry
Designed around how property companies actually work — not a generic survey tool

Get actionable insights
Identify the priorities that deliver the greatest impact

Follow the customer journey
All tenant feedback in one clear overview

Support for ESG and GRESB
Collect and report social sustainability data as a foundation for your sustainability reporting

Benchmark across multiple dimensions
Compare your results internally and externally against the industry
Why the industry choose AktivBo
AktivBo is a specialist with 30+ years of property industry experience focusing on turning data into benchmarked actionable insights and implementation.
Working alongside 500+ property companies across more than 20 countries, we see what works every day, and what doesn't. That depth of experience allows us to bring proven best practice directly to your organization, saving time and resources by building on what has already been tested elsewhere. Our dedicated customer teams and consultants support the full improvement cycle: from analyzing results and setting realistic goals to driving change management and ensuring that actions are followed through.
Giving tenants a voice matters, but unless the organization has the drive to act on what it hears, results will not improve on their own. Nine out of ten employees in a property company work in a customer-facing role. By setting clear satisfaction targets, measuring consistently, and structuring the improvement process, you show every employee that their work is central and makes a difference.

Survey tool
- Platform
- Focused on survey send-outs and administration.
- Benchmarking
- Not industry-specific.
- Surveys
- Generic survey templates.
- Implementation
- Create and administer your own surveys.
- Managed services
- Not industry-specific.
Research company
- Platform
- Generic workflow and functionality designed to fit all industries.
- Benchmarking
- Smaller selection of industry-specific benchmarking.
- Surveys
- Templates for different industries.
- Implementation
- Full service.
- Managed services
- Not industry-specific.
- Platform
- Industry-tailored workflow and functionality with advanced analysis functionality and filtering.
- Benchmarking
- Extensive industry-specific benchmarking across different segments and drill-downs.
- Surveys
- Tailored templates: CSAT, Customer Journey, and ESG questionnaires for the real estate industry.
- Implementation
- Full service, plus the option to create and administer your own surveys.
- Managed services
- Industry-specific.