



RESIDENTIAL REAL ESTATE
EUROPEANTENANT EXPERIENCE
REPORT 2026
An AktivBo report based on 518,042 tenant respondents across 265 individual tenant satisfaction surveys.
Table of contents
Download the report- Preface
- The value of feedback
- Increased tenant satisfaction pays off
- The ROI of tenant satisfaction
- Continuous measurement as an important KPI
- More data and insights open up more potential for improvement
- About the report & method
- A European view of residential tenant experience
Preface
Why tenant experience matters
In residential real estate, a high service ambition fosters retention. The tenants who stay are the ones who feel heard, and trust of that kind is built across numerous touchpoints: a clean stairwell, a returned call, a fault report that doesn't disappear into the system. Many organizations still lack a structured, comparable way to capture what those touchpoints actually deliver, and to see where attention is paying off. But many have come a long way, and that’s what we are capturing in this report.
At AktivBo, we have spent more than two decades helping property companies listen to their tenants, residential and commercial, across more than 20 countries. Our standardized survey methodology makes it possible to benchmark satisfaction not only within a portfolio, but across organizations, markets, and property types. The participants in this report share a commitment to using tenant feedback as a management tool, not merely an annual exercise.
156 of the 265 individual tenant satisfaction surveys come from Sweden, with the remaining 109 spread across 12 other European countries. In other words, the dataset is Sweden-heavy.
What the report reveals
This report complements quantitative satisfaction scores with a large-scale analysis of open-ended tenant comments, classified by topic and sentiment using AI.
The results confirm that the human element remains decisive. Tenants who feel well taken care of by their landlord consistently rate every aspect of their tenancy higher. Conversely, perceived neglect — slow responses, poor communication, unfulfilled promises — undermines satisfaction far more than any physical shortcoming of the home.
We hope this report offers insights and a chance to see where your organization stands relative to peers, and concrete evidence of where improvement efforts will have the greatest impact on tenant loyalty and retention.
The AktivBo Team behind the report

Jon Svensson
Chief Executive Officer

Frida Kullh
Chief Operating Officer

Martin Talme
Chief Business Officer

Vendela Meyerhöffer
Analysis & Customer Development

Jonatan Moen
Customer Development Manager
The value of feedback
Systematic tenant feedback creates measurable value, from lower vacancy and fewer complaints to stronger net operating income. Here is how structured measurement translates into results.
Stronger employee engagement
Structured tenant feedback gives front-line staff what engagement depends on: visible impact from their work, clear action plans, and recognition where improvement lands. The cycle reinforces itself — satisfied tenants generate proud staff, and proud staff deliver the service that satisfies the next tenant.
Lower vacancy and turnover
Tenants who feel heard stay longer. Each retained lease avoids re-letting fees, fit-out costs and months of empty rent. Vacancy is the largest avoidable cost in a residential portfolio, and a satisfied tenant is the most reliable way to reduce it.
Fewer complaints
When issues surface early through surveys, they can be resolved before they escalate. Proactive management reduces formal complaints and the resource cost of handling them.
Increased quality
Higher satisfaction supports stronger pricing power. Satisfied tenants are more willing to accept rental adjustments when they see that their landlord prioritizes their experience.
Efficiency benefits
Structured data replaces guesswork. Property managers can prioritize the right actions, allocate budgets more effectively, and demonstrate ROI on improvement initiatives.
Controlling excellence
By measuring and following up on external contractors, housing and real estate companies can ensure quality and costs in all agreements.
Brand development
Satisfied tenants are necessary to build a stronger brand. It helps in M&A processes, contract negotiations with external contractors, recruiting processes, and more.
Increased tenant satisfaction pays off
Tenant experience has long been treated as a soft issue in a hard industry. Customer orientation is a structural input to net operating income and it shows up in retention and tenant turnover, in operating cost and staff productivity, in brand strength, and in how a portfolio is valued by lenders, investors and ESG raters. Property companies that treat tenant satisfaction with the same seriousness as their financial metrics earn a measurable, repeatable return through the cycle. The ROI is real, and the next section puts a figure on it.
28 studies across 11 countries
Peer-reviewed and industry research from MIT, Henley, NAA, Vesteda, and more.
Proven ROI
Retention, vacancy, work-order cost, rent achievement along with other tangible metrics — translatable to hard financial outcomes.


The ROI of tenant satisfaction
Example portfolio
15,000 apartments
+1%pts tenant-satisfaction uplift
Assumptions:
Example: turnover cost €2,500/tenant; vacancy cost €1,100/month; faults 3/apt/yr at €150 each.
Continuous measurement as an important KPI
The case for continuous measurement
An increasing number of property companies are choosing to track tenant satisfaction continuously, through daily or weekly survey distribution, often integrated with their property management system. This reduces manual work, improves data privacy compliance, and makes it easier to embed customer insights into daily operations throughout the year.
From project to KPI
With continuous follow-up, results tend to become more even and representative over time. When feedback is collected on an ongoing basis, the risk of the overall picture being disproportionately affected by isolated events during specific periods decreases, and it becomes easier to distinguish temporary variations from actual trends.
Frequent follow-up turns tenant experience into a KPI that is systematically tracked, discussed, and continuously improved, rather than a project activated on an occasional basis.


More data and insights open up more potential for improvement
The tenant experience is not created by a single event but builds up step by step throughout the entire "customer journey," in dealing with the landlord's processes, communication, and services. From the first contact and signing of the contract, through move-in and ongoing administration, to reporting damage, customer service, and move-out, the overall impression emerges through a series of clear touchpoints. When these work well, they create an experience of order, security, and professionalism that strengthens the relationship over time.
This is why residential real estate companies are choosing to complement the annual overall assessment with targeted surveys at selected stages of the customer journey. By tracking several touchpoints, close in time to the events actually experienced, companies gain a more precise basis for improvement. It becomes easier to distinguish between one-off events and recurring points of friction, to understand at which point in the process the experience is impaired, and to prioritize the right measures in the right place. An at least equally important effect is that feedback occurs while it is still current, which creates better conditions for taking action quickly as soon as, or before, something does not go optimally.
Below you see an example of customer journey touchpoints for residential real estate companies.
 Contract signing
 Move-in
 Reconstruction
 Fault report
 Customer service
 Move-out
CSC: Residential
About the report & method
This report draws on data collected through AktivBo's standardized residential tenant satisfaction survey across Europe.
Who participates
Participants include municipal housing companies, cooperative housing associations, private landlords, and pan-European residential property owners and companies. Several use third-party property managers to run day-to-day operations.
What types of properties
The portfolio covers residential properties, primarily apartment buildings across urban and suburban markets in mature European housing economies.
How results are calculated
Each participant runs AktivBo's standardized residential tenant satisfaction survey, covering questions across service, product, value for rent, profile and attractiveness, plus NPS. Respondents rate their experience on standardized scales. Index and question results are presented as the positive share — the percentage selecting one of the two positive options on a four-grade scale. NPS is reported on the standard −100 to +100 scale. All scores are averages across surveys, giving each survey equal weight. In addition, 1,353,664 open-ended tenant comments were classified by category and sentiment.
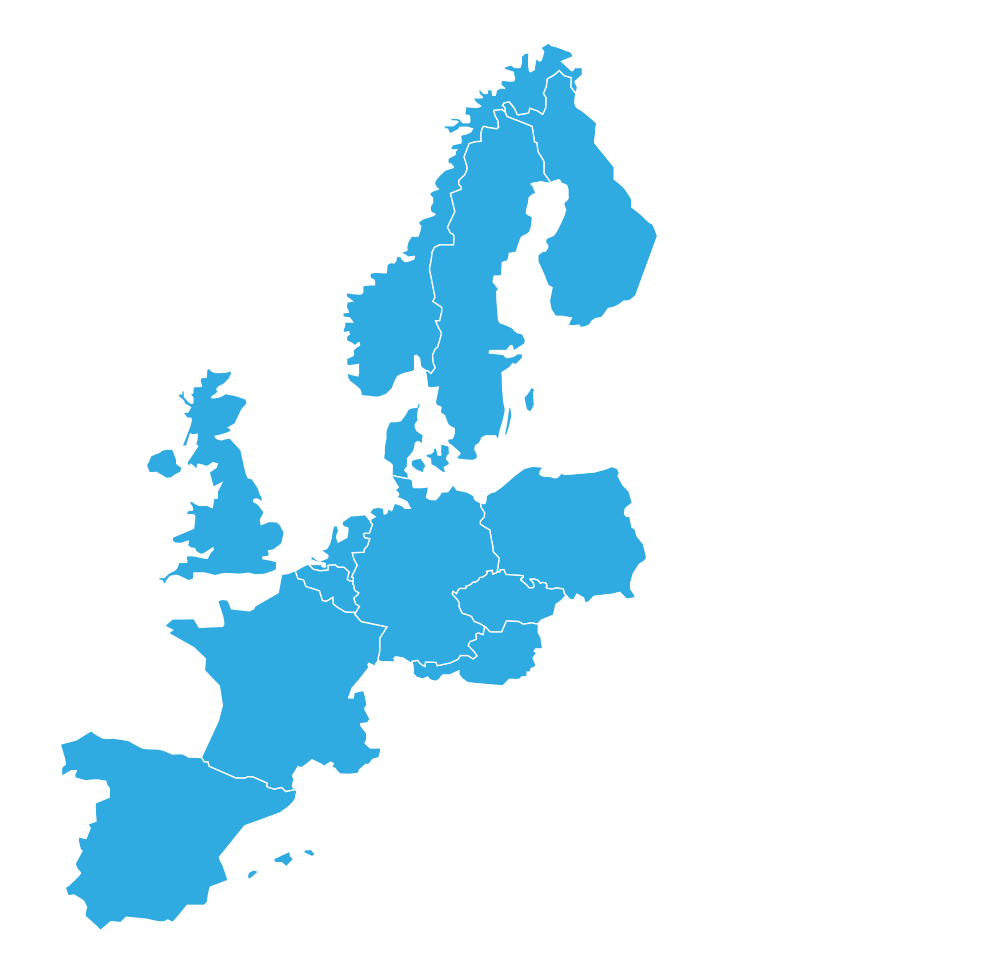
in 13 countries and 5 regions
Ownership composition: Number of tenant satisfaction surveys per ownership type
Private
Investor- or fund-owned landlords; property-management firms
Municipal
City- or state-owned housing companies
Cooperative
Member-governed housing associations
A European view of residential tenant experience
The dataset spans 265 individual tenant satisfaction surveys across 13 European markets, grouped into five regions for comparison.
Benelux
- Belgium
- Netherlands
DACH
- Austria
- Germany
Nordics
- Denmark
- Finland
- Norway
Other Europe
- Czech Republic
- France
- Poland
- Spain
- United Kingdom
Sweden
- Sweden
Key findings at a glance
What tenants value
Treatment by staff scores highest. The in-the-moment human encounter is residential's strength: Three of the four highest-scoring questions are about how tenants are treated.
Top scoring service questions
Where to act
The service approach is strong but unreliable on follow-through. Action taken as a result of contact (71.9%) and Getting the issue fixed within a reasonable timeframe (74.2%) sit at the bottom. The opportunity is operational discipline, not soft skills.
Lowest-scoring Take the Customer Seriously question
Sustainability as a competitive factor
Sustainability issues continue to be central. This development is driven partly by stricter regulations and reporting requirements, and partly by tenants increasingly factoring sustainability into their decisions. The focus on sustainability has had a growing impact on the real estate industry, not least in connection with reporting and standards such as CSRD and GRESB. Sustainability also affects the ability to retain and attract customers. This year's results show that sustainability remains an area where expectations are high.
Want to learn how to get up to 6 GRESB points?
AktivBo is a:


The CustomerScoreCard™
(CSC)
The CustomerScoreCard™ is AktivBo’s structured tenant satisfaction survey and the overall measurement framework that captures every relevant dimension of the residential living experience. It is AktivBo's implementation of what the wider industry knows as CSAT (Customer Satisfaction) or TSM (Tenant Satisfaction Measurement), with the Service Index as its principal satisfaction KPI. Built on more than 30 years of methodological development and a consistent 4-grade response scale, the CSC provides a comparable basis for benchmarking across European residential portfolios. Every number in this report originates in the CSC.
Six main indexes
The CSC summarizes tenant experience through six main indexes.
service and customer care
the landlord
rent vs. quality received
the physical product
appeal of the property and the area
loyalty (probability of recommending the landlord)
The five indexes ranked
Total scores across the headline indexes, alongside the regional view.
Total result
(average across all surveys)
Indexes sorted by AktivBo's method and actionability
Regional view
(average across surveys in the region)
| Benelux | DACH | Nordics | Other Europe | Sweden | |
|---|---|---|---|---|---|
| Service Index | 66.8% | 72.6% | 76.0% | 71.3% | 82.2% |
| Product Index | 70.4% | 69.3% | 74.1% | 79.1% | 78.8% |
| Profile | 50.4% | 71.5% | 71.6% | 62.6% | 79.9% |
| Attractiveness | 76.2% | 82.5% | 82.5% | 72.0% | 86.8% |
| Value for rent | 48.4% | 75.7% | 69.9% | 57.0% | 70.6% |
Service Index
- Service as the headline indicator of tenant satisfaction
- Total Service Index and regional comparison
- Four sub-indexes (Take the Customer Seriously, Security, Clean and Tidy, Help When Needed) — total and regional view
- Question-level deep-dive within the relational sub-indexes, and where the sub-indexes diverge most across regions

Service Index and the framework around it
A short orientation to AktivBo’s measurement structure, and to the index that anchors this report.
Service Index — most important index for tenant satisfaction
The Service Index is the most important index for tenant satisfaction, and the most central within the CustomerScoreCard™. It captures the dimensions most within management’s control, such as availability, conduct, information, speed of response and follow-through. Three decades of AktivBo data show that service is consistently among the strongest drivers of overall satisfaction, and improvement here typically requires routine and discipline rather than capital investment. That is why this report leads with it, and why most of the analysis that follows is anchored in the Service Index.
Inside the Service Index — four sub-indexes
The Service Index breaks down into four themed sub-indexes:
Take the Customer Seriously
contact, information, treatment, follow-up
Security
perceived safety in and around the property
Clean and Tidy
day-to-day standards of common areas
Help When Needed
issue reporting, resolution time, quality of work
These sub-indexes show where a Service-Index gap sits, and where an action plan should focus.
Service Index:
Total and regional view
Service Index sits at 78.3% across 265 tenant satisfaction surveys.
Service Index sub-indexes
The Service Index reads 78.3% at total, a respectable headline that hides a wider regional spread. Sweden leads on every sub-index; Benelux trails on three out of four. The divergence sits in the two relational sub-indexes — how tenants are treated and how reliably issues are resolved — while the physical sub-indexes hold steady across markets. Strategy at total level under-prices the execution gap; meaningful uplift has to be planned region by region, not portfolio-wide.
Four sub-indexes make up Service Index. Help When Needed sits highest at total level; Clean and Tidy sits lowest.
Take the Customer Seriously
Service Index sub-index covering contact, information, treatment and follow-up.
Take the Customer Seriously by region
| Highest-scoring questions in this sub-index | (Total) |
|---|---|
| Treatment by the property caretaker | 91.2% |
| Treatment when reporting an issue | 86.6% |
| Treatment at last contact | 86.2% |
| Lowest-scoring questions in this sub-index | (Total) |
|---|---|
| Keeping promises | 77.2% |
| Telephone availability of the landlord | 76.8% |
| Action taken as a result of contact | 71.9% |
Help When Needed
Across both relational sub-indexes, the in-the-moment encounter scores high: 91% on caretaker treatment, 88% on the post-work clean-up. Reliability of outcome sits materially lower: 72% on Action taken as a result of contact, 74% on Getting the issue fixed within a reasonable timeframe. The improvement opportunity is operational discipline, not interpersonal skill. Process gaps of this kind are where tenant turnover quietly accumulates.
Service Index sub-index covering issue reporting, resolution time and quality of work.
Help When Needed by region
| All four questions in this sub-index, sorted high → low | (Total) |
|---|---|
| How the caretaker cleaned up after the work | 88.2% |
| Reporting the issue | 85.8% |
| Quality of the work carried out | 79.9% |
| Getting the issue fixed within reasonable time | 74.2% |
Service Index: where the regions differ most
Sub-indexes ranked by the gap between the highest and lowest regional score.
Regional spread
(lowest to highest region)
CASE: Stena Fastigheter
When the Customer Journey becomes a competitive advantage
When Cecilia Fredholm Vaarning, Head of Sustainable Business at Stena Fastigheter – one of Sweden's largest real estate companies – talks about the company's digital development, the focus is not on systems, platforms, or technology shifts. It is about relationships. For her, digitalization is a tool for deepening the customer dialogue, strengthening everyday security, and creating a more predictable experience. That, in turn, builds a stable and profitable business over the long term.
The starting point is Stena Fastigheter's long-term, relationship-based property management. As a family-owned company with roughly 29,000 homes and 2,000 commercial tenants, it has spent decades building the business on presence in the neighborhoods, social investment, and physical upgrades. When the company took a comprehensive approach to the customer journey, the ambition was therefore not to streamline people out of the equation. It was to reinforce what carries the business over time: the customer relationship.
The transformation was built on the principle that the customer shows the way. The goal was to create a digital highway across the entire customer journey, always with a person in the background. For Stena Fastigheter, the digital is personal. Behind every login is an individual with a concrete everyday question, a concern, or a need for quick help. At a time when customers expect immediate feedback, predictability and clear information are a central part of how security is experienced.
Three building blocks that have delivered results:
1. Build a personalized and predictable customer journey
The company rebuilt its entire customer portal and created a personalized flow where the customer always meets the right information at the right moment. Cases are routed automatically to the right person, and the customer receives ongoing feedback, for example through push notifications.
The results are clear. The share of digital cases rose from around 10 percent to more than 90 percent. At the same time, incoming calls fell sharply, and the customers who do reach the customer center come with more qualified questions. The effect is not fewer relationships. It is better relationships. Less friction in everyday life strengthens the sense of professionalism and reliability.
2. Bring the customer dialogue in-house and standardize the processes
A decisive change was to bring the customer center in-house and work with consistent processes and clearer roles. Nearly a third of all employees were involved in the development work to identify the “roadworks” in the organization, meaning the things that created unnecessary complexity for the customer.
This internal change work freed up time across the organization. When digital flows handle routine cases, property managers and housing officers can spend more time out in the neighborhoods, where relationships and security are genuinely built. Digital efficiency therefore became an enabler of greater local presence rather than a replacement for it.
3. Use data for care and predictive service
Stena Fastigheter works actively with data to reduce irritation and prevent questions before they arise. By analyzing customer behavior and giving proactive feedback, the company creates a feeling of being seen and taken seriously.
An important insight from this work is that the digital and the physical are not in opposition. Quite the opposite. Investments in safe, well-managed neighborhoods, social initiatives, and local engagement are reinforced by a smooth, transparent, and personal customer dialogue. Taken together, the physical, the social, and the digital create a stronger brand and more stable cash flows.
The business logic is clear. When the customer knows who to turn to, when answers come quickly, and when communication feels human, trust grows. And trust is a competitive advantage. Less friction in the customer journey reduces operational load, strengthens the relationship, and contributes to higher customer satisfaction, which over time affects attractiveness, occupancy rates, and results.
Key drivers & Service Index
- Correlation across 265 tenant satisfaction surveys
- Each question’s survey-level score correlated against the Service Index
- Overall ranking, per-region ranking, and a regional-contrast view across the next three pages
Top five key drivers
The top five Service-Index drivers are dominated by Take the Customer Seriously (four out of five); Reporting the issue from Help When Needed completes the list.
| Rank | Question | Parent (sub-index / area) |
|---|---|---|
| 1 | Overall contact with the landlord | Take the Customer Seriously |
| 2 | The e-mail handling by the landlord | Take the Customer Seriously |
| 3 | Info about what is happening at the property | Take the Customer Seriously |
| 4 | Treatment when reporting an issue | Take the Customer Seriously |
| 5 | Reporting the issue | Help When Needed |

Top five key drivers by region
The same correlation method run separately for each region.
Method: Correlation with Service Index in each region's surveys, calculated separately.
Benelux
- General info from the landlord
- Feeling of safety in the cellar/loft
- Apartment’s layout
- The security of the storage area
- Telephone availability of the landlord
DACH
- The e-mail handling by the landlord
- Treatment by the property caretaker
- Would recommend the local area
- Treatment when reporting an issue
- How the caretaker cleaned up after the work
Nordics
- Overall contact with the landlord
- Receiving information during the case
- Landlord’s chat
- Info about what is happening at the property
- Getting hold of the right person
Other Europe
- Reporting the issue
- Telephone availability of the landlord
- The e-mail handling by the landlord
- Visiting times for the landlord
- Quality of the work carried out
Sweden
- Overall contact with the landlord
- Staff keeping their promises
- Does the landlord take care of the tenant
- The e-mail handling by the landlord
- Action taken as a result of contact
Where regional drivers diverge
Top-driver themes per region, with the constants and the contrasts highlighted.
Constants across regions
Take the Customer Seriously anchors every region. Sweden, Nordics, DACH and Other Europe each have three or more Take the Customer Seriously questions in their top five; Benelux has two. The relational service backbone holds across Europe.
Written-channel contact (e-mail, chat, or telephone) sits in the top five in every region. Tenants everywhere weigh how reachable the landlord is, even where the dominant theme differs.
Every region's #1 driver sits between 0.90 and 0.99 (Sweden 0.93, Nordics 0.99, DACH 0.91, Benelux 0.90, Other Europe 0.97). Top-driver strength is remarkably uniform across very different driver mixes.
Product Index
- Three sub-indexes: Public areas, Outdoor environment, Apartment
- Total Product Index and regional comparison across the three sub-indexes
- Outdoor environment as the structural weak point across the Product Index

Product Index — what tenants think of the property and surrounding areas
A short orientation to AktivBo’s Product Index and its sub-indexes.
What the Product Index measures
The Product Index captures tenants’ perception of the property and surrounding areas they live in: the apartment itself, the building’s common areas, and the immediate surroundings. Where the Service Index reflects how the landlord runs the relationship, the Product Index reflects what the landlord owns and maintains. Together they give a complete picture of tenant experience: service on one side, the physical asset on the other.
Three sub-indexes
The Product Index breaks down into three themed sub-indexes:
Public Areas — common entrances, stairwells, lifts, corridors and shared interior spaces
Outdoor Environment — gardens, courtyards, parking, lighting and landscaping
Apartment — the dwelling itself, including layout, equipment and condition
Each sub-index isolates a distinct improvement lever, so targeted investment can be planned against the specific area that drives the gap.
Product Index & the three sub-indexes
Public Areas (82.2%) and Apartment (77.4%) hold steady across regions, but Outdoor Environment is the lowest-scoring Product Index sub-index in every region except Benelux. DACH sits markedly lower at 55.5%.
The sub-indexes (Public Areas, Outdoor Environment, Apartment) give a fuller view.
Value for Rent, Profile, Attractiveness
- Value for Rent — perceived balance between rent paid and quality received
- Profile — how the landlord is perceived as an organization
- Attractiveness — appeal of the property and the surrounding area
- Total and regional comparison across all three indexes
Value for Rent, Profile, Attractiveness
Three indexes complementing service and product: perceived value-for-rent, brand trust (Profile), and area appeal (Attractiveness).
Net Promoter Score
- Probability of recommending the landlord to friends and family
- Scale −100 to +100
- Total and regional view across the individual surveys
NPS total and regional view
NPS by region
(−100 to +100)
Ownership type: deep-dive
- Service Index by ownership type: total and region-by-region
- The ownership cut for private, municipal and cooperative landlords

Service Index by ownership type
Cooperative and municipal sit at 6.7 and 7.2 percentage points respectively above private at total level. The pattern holds in every region with enough data to compare.
Service Index — Region × Ownership
Average Service Index per region × ownership cell.
| Region | Private | Municipal | Cooperative |
|---|---|---|---|
| Benelux | 66.8% | – | – |
| DACH | 66.3% | 75.5% | 81.1% |
| Nordics | 74.8% | 80.8% | – |
| Other Europe | 69.9% | 79.9% | – |
| Sweden | 80.3% | 83.6% | 81.5% |
In DACH the ownership gradient is sharpest: private 66.3% → municipal 75.5% → cooperative 81.1%. In Sweden the gap is narrower (private 80.3% → municipal 83.6%). Cells with — have no surveys for that ownership × region combination. Averages across surveys.
Sentiment Analysis
- Open-text comments classified by category and sentiment
- Where tenants speak strongly — and where they don't
- When scores and words disagree: Categories with high scores but high negative comment share
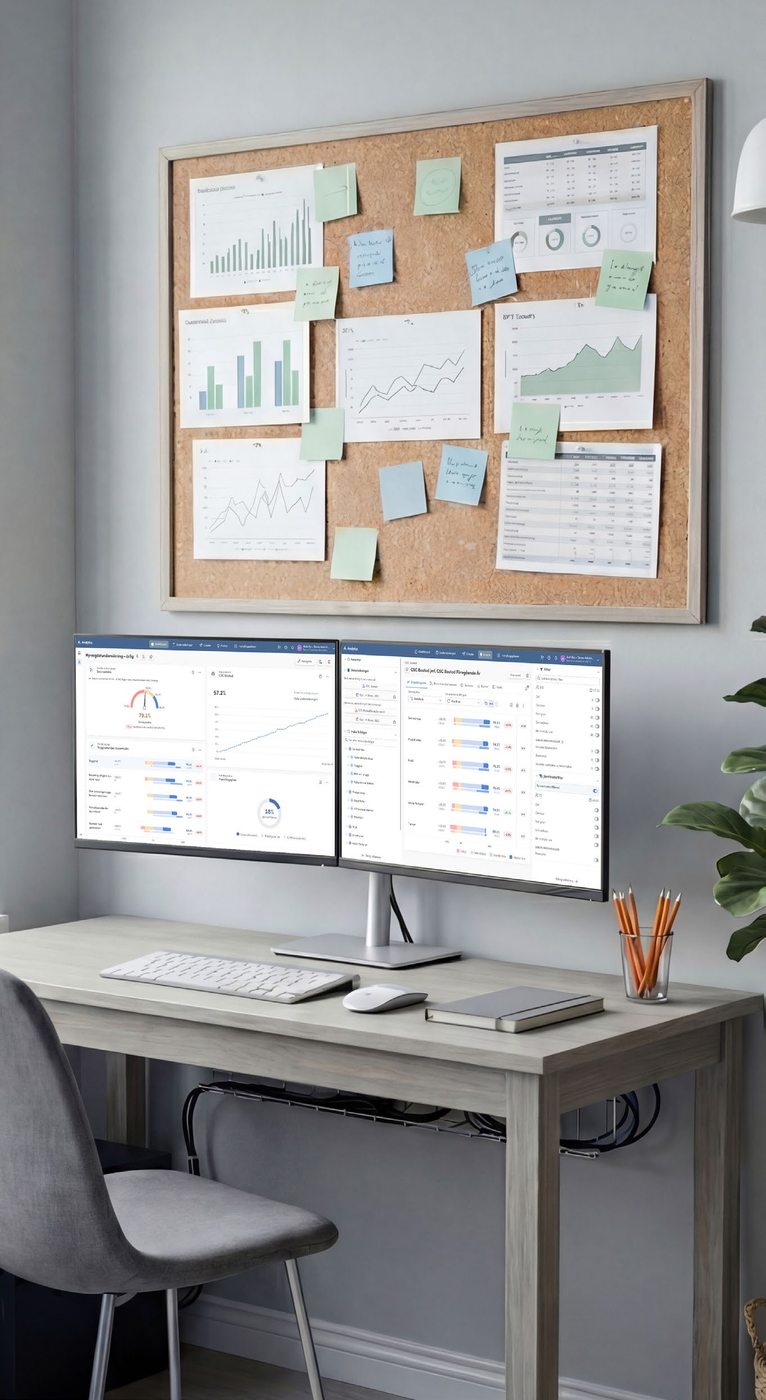
Agentic AI turns tenant feedback into actionable intelligence
Built for property, powered by data
AktivBo builds AI services that are unique of their kind, developed exclusively to analyze tenant feedback. This is made possible by the fact that we operate in a single vertical — the real estate industry — working alongside 500+ property companies across more than 20 countries. It is the specialization, and the depth of data, that allows our models to recognize the industry’s patterns, terminology and connections.
How it works
AI agents interpret, classify, and prioritize unlimited amounts of responses automatically — connecting each comment to the right category and touchpoint in the customer journey. The models don't just categorize sentiment; they identify where frustration concentrates, flag emerging risks, and surface the actions with the greatest impact on satisfaction and retention.
From quantitative data to qualitative insights
In practice, this means that thousands of open-ended responses from tenants can be interpreted, summarized and connected to the right touchpoint in the customer journey. The platform automatically surfaces the actions that have the greatest impact on tenant satisfaction, and satisfied tenants ultimately lead to lower vacancy rates and stronger net operating income.
This is AI that does not guess
It compares, prioritizes, and points the way forward. Every comment is linked to the relevant category, placing tenants’ own words in relation to the areas being measured.
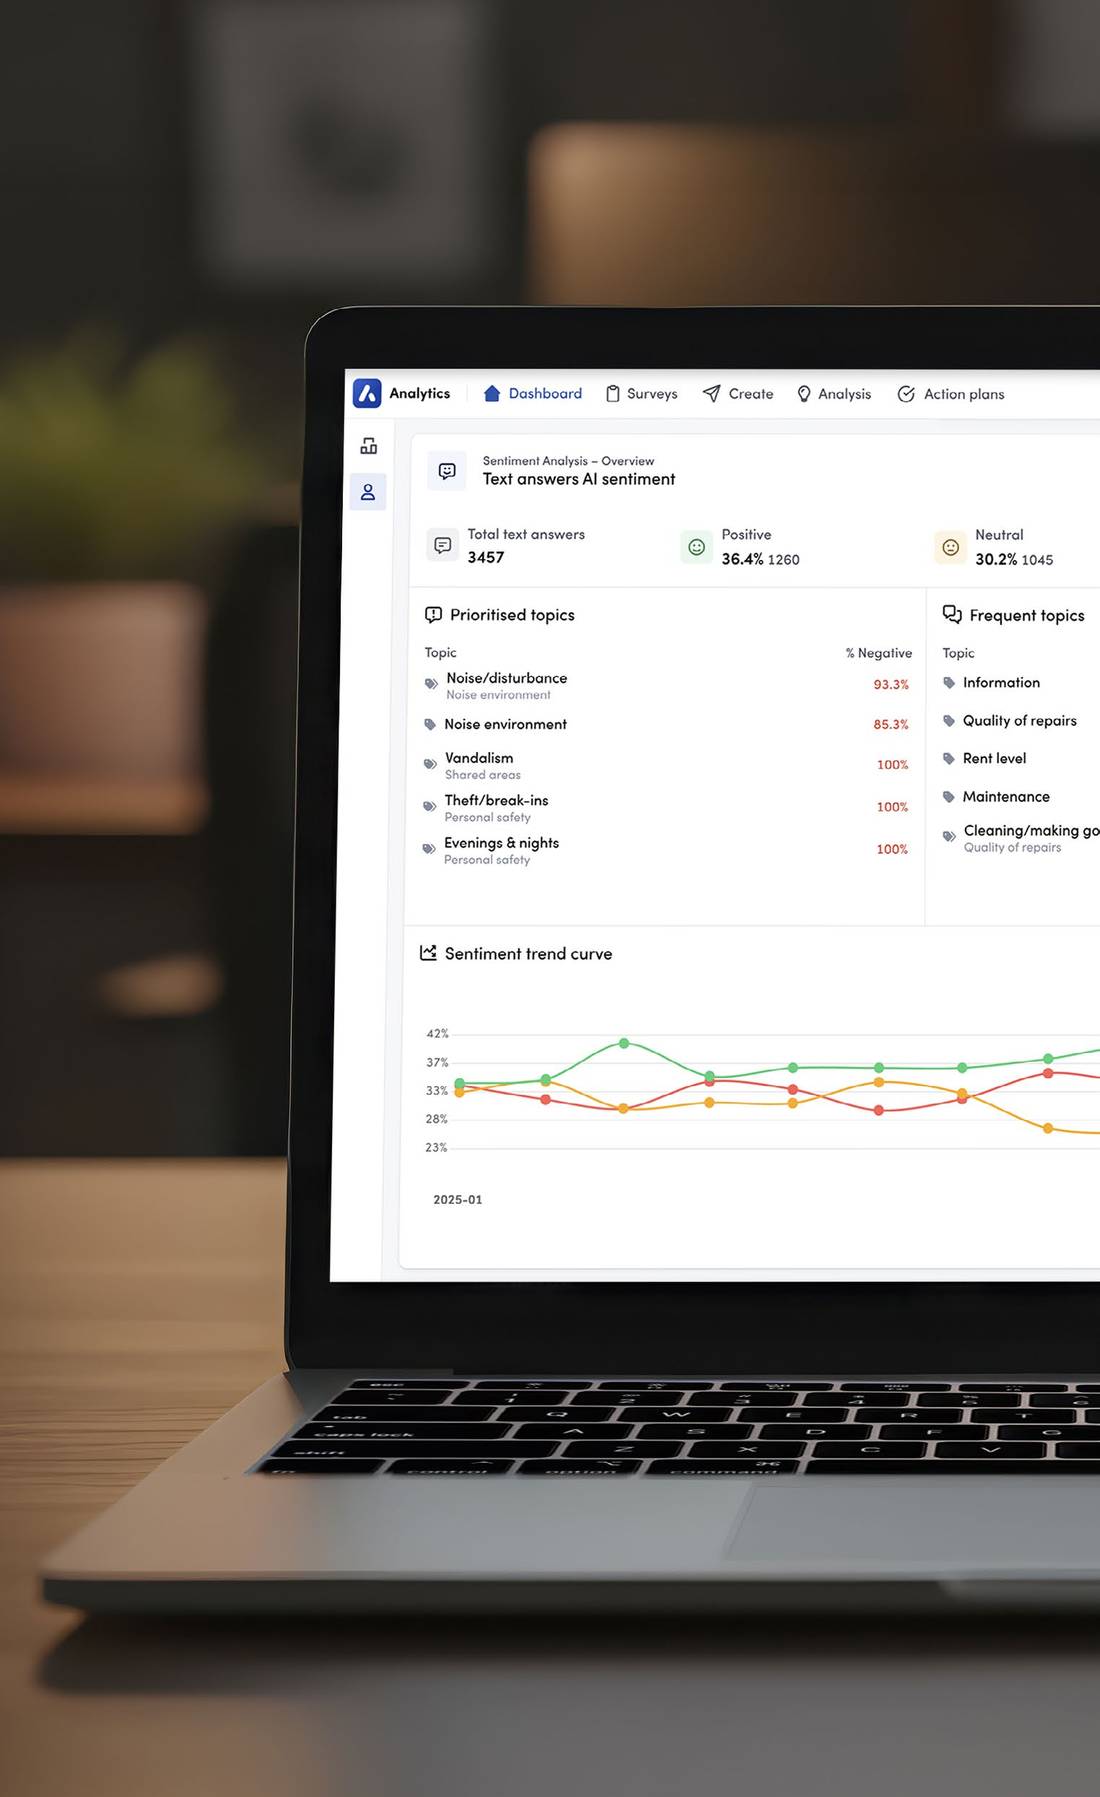
Topics and sentiment in tenant comments
The ten topics that draw the most negative comments, by volume and by intensity.
The index scores show how tenants rate their tenancy. The open comments show why: the reasons behind those scores, in their own words. The analysis is based on 1,353,664 open-ended comments, classified by topic and sentiment and linked to the area each one concerns. The ten topics that draw the most negative comments to the right read two ways: the number of negative comments a topic draws, and how negative it is once raised.
Volume and intensity are separate signals. The ranking counts negative comments; the pill shows how negative a topic is once raised. Fault reporting and Getting faults fixed sit lower on volume but are the most negatively-charged (72% and 54%); Traffic & parking and Contact channel make the list on mention count, only about a third negative.
Top 10 topics by negative comments
Bar: frequency of negative comments, which sets the ranking.
Pill: how many of the topic's mentions are negative.
What the comments add to the scores
The index shows where satisfaction sits; the comments explain why, and where to act.
Lowest-scoring questions
Reporting and resolving faults
The two lowest Service questions (Action taken as a result of contact, 71.9%, and Getting the issue fixed in reasonable time, 74.2%) mark where the gap is. The comments show why: Fault reporting (72% negative) and Getting faults fixed (54%) are the topics with the highest negative sentiment, where cases stall without an update.
Inside the Service Index
Contact and information
The Service Index is the report's headline KPI, anchored by the relational sub-index Take the Customer Seriously (79.8%), revealing the service top drivers. The comments agree: Contact channel / reachability and Information from landlord both sit in the top ten. Only 32% and 37% of those mentions are negative, so the signal is volume, not intensity: reachability and clear information are what tenants raise most.
Beyond the rated questions
Topics the survey does not score
Some of the most negative-comment topics are not isolated by the rated questions. Waste management is the third-largest source of negative comments yet is not a headline index question. The open text surfaces it where the score cannot. Traffic & parking is the same kind of signal: it sits inside Outdoor Environment (75.6%), the Product weak point the closing flags, and the comments show where that weakness bites.
Index scores and comment sentiment, side by side
A combination of scores and text comments will give the full picture. The index locates the result and the comments give the reason and the action.
The rated questions confirm a real strength: the in-the-moment encounter is among the highest-scoring in the survey. The remaining gap sits in closure rather than contact. Tighten the process that turns a reported fault into a fixed one.
Index
rated questions
- Treatment by caretaker91.2%
- Cleaned up after work88.2%
- Treatment when reporting86.6%
Comments
(% negative)
- Fault reporting72%
- Maintenance & standard69%
- Getting faults fixed54%
What this report shows
The total understates the regional execution gap
At 78.3% the Service Index total sits above four of the five regions; Sweden's 82.2% pulls the headline upward, while Benelux (66.8%) and Other Europe (71.3%) sit furthest below it. Plan and target intervention at regional level — the total under-prices the work.
Service drivers are relational, not physical
After excluding Profile and Value-for-Rent questions, the top five Service-Index drivers are dominated by Take the Customer Seriously (four of five); Reporting the issue from Help When Needed completes the list. Service-Index uplift runs through contact, follow-up and treatment, not the building.
Regional driver themes share a backbone, diverge on edge cases
Take the Customer Seriously anchors every region’s top five drivers. Edge-case differentiation runs from Sweden’s emphasis on trust and follow-through, to the Nordics’ information flow, DACH’s personal-treatment moments, Benelux’s physical-asset focus and Other Europe’s issue-resolution lifecycle. One backbone, five flavors.
Outdoor Environment is the structural weak point in product
Public Areas (82.2%) and Apartment (77.4%) hold steady across regions, but Outdoor Environment (75.6%) is the lowest-scoring Product Index sub-index in every region except Benelux. The highest-return product lever in the portfolio.
AktivBo Analytics
A Tenant Experience platform driven by agentic AI

Built for the real estate industry
Designed around how property companies actually work — not a generic survey tool

Get actionable insights
Identify the priorities that deliver the greatest impact

Follow the customer journey
All tenant feedback in one clear overview

Support for ESG and GRESB
Collect and report social sustainability data as a foundation for your sustainability reporting

Benchmark across multiple dimensions
Compare your results internally and externally against the industry
Why the industry choose AktivBo
AktivBo is a specialist with 30+ years of property industry experience focusing on turning data into benchmarked actionable insights and implementation.
Working alongside 500+ property companies across more than 20 countries, we see what works every day, and what doesn't. That depth of experience allows us to bring proven best practice directly to your organization, saving time and resources by building on what has already been tested elsewhere. Our dedicated customer teams and consultants support the full improvement cycle: from analyzing results and setting realistic goals to driving change management and ensuring that actions are followed through.
Giving tenants a voice matters, but unless the organization has the drive to act on what it hears, results will not improve on their own. Nine out of ten employees in a property company work in a customer-facing role. By setting clear satisfaction targets, measuring consistently, and structuring the improvement process, you show every employee that their work is central and makes a difference.

Survey tool
- Platform
- Focused on survey send-outs and administration.
- Benchmarking
- Not industry-specific.
- Surveys
- Generic survey templates.
- Implementation
- Create and administer your own surveys.
- Managed services
- Not industry-specific.
Research company
- Platform
- Generic workflow and functionality designed to fit all industries.
- Benchmarking
- Smaller selection of industry-specific benchmarking.
- Surveys
- Templates for different industries.
- Implementation
- Full service.
- Managed services
- Not industry-specific.
- Platform
- Industry-tailored workflow and functionality with advanced analysis functionality and filtering.
- Benchmarking
- Extensive industry-specific benchmarking across different segments and drill-downs.
- Surveys
- Tailored templates: CSAT, Customer Journey, and ESG questionnaires for the real estate industry.
- Implementation
- Full service, plus the option to create and administer your own surveys.
- Managed services
- Industry-specific.